
THE GAP
AI Demand Arrives in Tokens, and Most of it is Invisible
Infrastructure teams are used to measuring compute in GPU-hours or seat counts. AI inference doesn't work that way. It arrives as tokens (the chunks of text a model reads and writes) and as requests that happen at the same moment, from thousands of people who never file a request for capacity. Today most of that use runs on commercial tools: API keys, gateways, and AI seats such as ChatGPT Edu or Microsoft 365 Copilot.
That leaves three blind spots. Volume: nobody adds up tokens across every tool. Peaks: seat licenses report users, not how many requests are in flight at the busiest minute. Sensitivity: nobody has mapped which of that use touches protected data and must stay in-house.
Size an AI factory without those numbers and you either buy too much hardware or build something that falls over in the first busy month.
WHAT THE CENSUS MEASURES
The Numbers that Size an AI Factory
TOKENS & SPEND
Input, cached and output tokens, requests and spend per working day, for each model, app, team or deployment.
PEAKS
Requests per second at the 99th-percentile minute, requests in flight, and the share that was rate-limited.
DAILY & SEASONAL SHAPE
Tokens by hour of day and day of week, and month-by-month seasonality when a year of data exists.
PEOPLE & SEATS
Unique people across products (counted, never identified), and licensed, active and unused seats.
HOW IT WORKS
From the Exports You Already Have to a Right-Sized Plan
01 | Scoping Call
We confirm which AI products you use, who can export each one, and how much history exists. You get a preparation guide with the exact export steps for each source.
02 | Export
Your team pulls usage with your own admin tools or Venturi's export script, using your own keys. If policy requires, strip content and hash identities before anything leaves your systems.
03 | Run the Census
Files are read row by row in a web browser, yours or ours, and reduced to counts: tokens per minute, day and month, hourly curves, peaks, people and seats. Nothing is uploaded. When a gateway sits in front of a provider, the same traffic is counted once.
04 | Validate and Model
We review each workload with your team and confirm the open-weight model it is sized as. The Sizer then models every workload on its own calendar in one shared factory, and compares owning the peak with sizing for a normal month and sending the overflow to a hosted service.
05 | Readout
You get an executive summary written for your industry, a 5-year cost of ownership, a comparison with what you pay today for APIs and AI seats, and a clear recommendation: run a pilot, instrument further, or keep consuming AI as a service.
SUPPORTED SOURCES
Start with the Usage Data You Already Have
The census reads two kinds of exports. Every input in the results is labeled as measured, supplied by you, or a preset, so you can see how much of the answer rests on real data.
Usage Logs: API and Gateway Traffic, Measured per Request or per Minute
LiteLLM (gateway): the LiteLLM_SpendLogs table, as CSV or JSON Lines. Rate-limited requests (429s) are counted into the peak. Failed requests are skipped.
OpenAI API: the export script's openai command, which needs an admin key. It gives 1-minute buckets by model and project.
Azure OpenAI (AI Foundry): platform metrics from two az monitor metrics commands, one week per file, at 1-minute detail. The second command captures 429s.
AWS Bedrock, invocation logs: log files from S3 (.json.gz) or the CloudWatch log group. Run the script's strip command first so prompts and responses never leave your systems; it keeps the response time.
AWS Bedrock, CloudWatch metrics: per-model metrics, for when invocation logging is off. This includes throttles.
Fireworks: per-request billing metrics from firectl, at most 31 days per CSV file.
In-house gateway: any CSV or JSON Lines log, mapped by hand. The mapping is remembered for that gateway's next file.
Seat Licenses: per-User Activity Reports
ChatGPT Enterprise / Edu: the admin Users CSV.
Microsoft 365 Copilot: the Copilot usage report CSV from the admin center.
Using something else? Tell us at the scoping call. Any request log with times and token counts can come in through the in-house gateway path, and we confirm every source before you export anything.
YOUR CHOICE
Two Ways to Run a Census
Customer-Run
Your team runs the census in your own browser and sends us only the summary file, a readable, counts-only summary you can open and review first. Raw files never leave your premises.
Consultant-Run
A Venturi TS consultant runs the census with you. Usage telemetry measurements are processed in the consultant's browser during the session with your team.
WHY MEASURE FIRST
One Unmeasured Input Can Triple the Right Answer
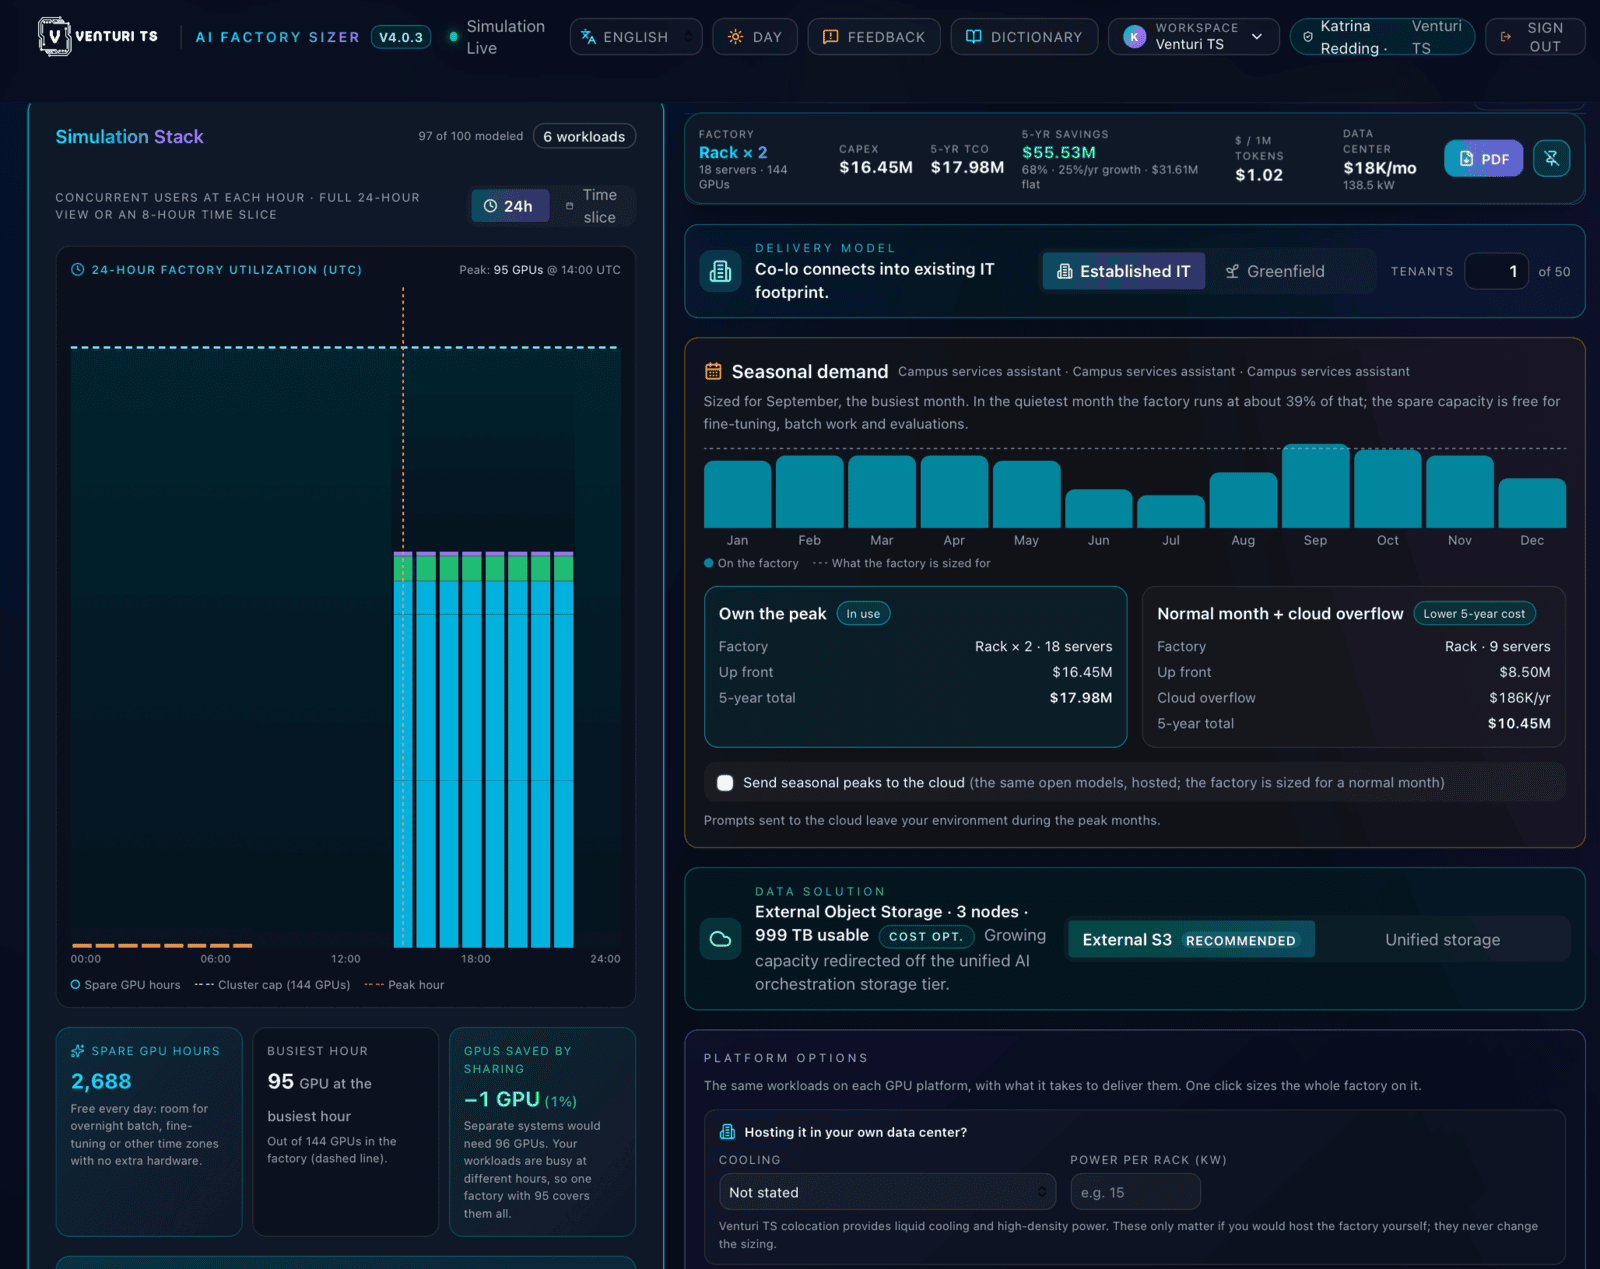
At a regular usage level (about 30 chat turns per person per day), the whole scenario fit on 48 GPUs, with a 5-year cost of ownership of about $7.2 million against about $22 million for the same tokens on frontier APIs.
Then we changed one input: how heavily students use the assistant. At all-day use (about 80 turns per day), the right factory grew to 144 GPUs and about $18 million over five years. Same users, same models, same calendar. Owning still beat renting at both levels, but the right size moved about 3x.
Usage intensity is the most expensive unknown in an AI plan, and almost nobody has measured it. That is what the census is for.
3x
Swing in the right factory size from one usage input.
48 to 144
GPUs, regular use vs. all-day use (modeled).
< 5 mins
To build the full scenario. Knowing the inputs is the hard part.
Modeled and illustrative. Venturi AI Factory Sizer v3.9 on NVIDIA H200 servers, Mountain time, without high availability. Figures are budgetary planning estimates, not quotes. Frontier API comparison at current list prices, held flat at today's volume.
DELIVERABLES
What You Walk Away With
What You Get
A measured demand profile: tokens, peaks, hourly and monthly shape, people and seats.
The right-sized AI factory for all workloads combined, from a desk-side pair of NVIDIA DGX Sparks up to multi-rack deployments, with platform options.
A budgetary bill of materials and a 5-year cost of ownership, including power, colocation and operations, and the cost per million tokens.
Own-the-peak vs. normal-month-plus-overflow, side by side, with protected workloads kept in-house.
What you spend today on APIs and AI seats, including unused seats, against the cost of owning.
An executive summary written for your industry, with every input labeled as measured, supplied or preset.
A recommendation: pilot, instrument further, or keep consuming. If renting is cheaper, the report says so.
One thing we do keep. When a signed-in person downloads a PDF report, a short note is filed to that person's contact record in our CRM. The report's census section holds counts only. You can ask us to delete CRM records at any time.
Data Handling
Built to pass a security and privacy review.
Counts only. Usage files are read inside a web browser and reduced to totals. Only counts leave the browser, and nothing is uploaded.
No content. Prompts, responses and documents are never read. Content columns are flagged, not read or kept, and the export script's strip command removes them before files leave your systems.
People are counted, not identified. Emails and user IDs become salted hashes in the browser. The salt is never sent or saved and is gone when the page closes, so one census cannot be linked to another. You can also hash identities yourself first, with your own salt.
Never leaves the browser: raw rows, prompts, responses, request bodies, emails, user IDs, hashes, API keys or IP addresses.
Nothing stored on our server. The Sizer server stores and logs nothing from the census. It keeps sign-in records and a count of workloads modeled, as for any Sizer use.
Your keys stay with you. The export script runs on your machine with your own admin keys, which are never sent to Venturi. It uses only the Python standard library, lists every endpoint it calls and every field it writes, and its SHA-256 is published so your team can verify it.
AFTER THE CENSUS
Make Decisions Based on Actual Data
NEXT STEP
Replace Estimates with Observed Peaks
Seat reports show people and activity, not tokens, so some workloads are partly estimated. Where the census shows real demand but thin data, we can run a metered pilot for a semester or a quarter: a Venturi Micro Factory or a small inference node connected to your existing gateway.
It serves real users and records actual tokens, concurrency and peaks, so the next decision rests on measurements.
WHO IT'S FOR
Built for Organizations with Big, Uneven AI Demand
CIOs, research computing directors and AI program leads in higher education, state government and healthcare, plus any enterprise deciding whether to bring AI inference in-house, and the compliance teams who review the data. Our first cohort focuses on these use-cases: state universities and colleges, state agencies and health-data groups, where usage is large, seasonal and largely unmeasured.
FAQ
Common Questions About the Census
NOT THE LARGEST AI FACTORY. THE RIGHT ONE.
Measure the Tokens Before You Buy the GPUs
Start with a 30-minute scoping call. Tell us which AI tools your people use today, and we'll tell you what a census would measure, what your team would need to export, and whether it's worth doing. Venturi TS is a veteran-owned technology partner based in Sandy, Utah, and an NVIDIA Inception member.
LEARN MORE
Related Reading
Cost per million tokens, explained.
Consumption vs. Capability
From prompt to answer.
Tokenomics: Tech Talk #03